Explain with neat sketch the stress-strain diagram for ductile material.
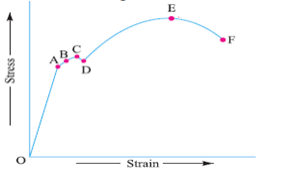
Point A: Proportional limit Point B: Elastic limit Point c: Upper yield point Point D: Lower yield point Point E: Ultimate tensile stress point Point F: Breaking Stress point. 1. Proportional limit. We see from the diagram that from point O to A is a straight line, which represents that the stress is proportional to strain. Beyond point A, the curve slightly deviates from the straight line. It is thus obvious, that Hooke's law holds good up to point A and it is known as proportional limit. It is defined as that stress at which the stress-strain curve begins to deviate from the straight line. 2. Elastic limit. It may be noted that even if the load is increased beyond point A upto the point B, the material will regain its shape and size when the load is removed. This means that the material has elastic properties up to the point B. This point is known as elastic limit. It is defined as the stress developed in the material without any permanent set. 3. Yield point. If the material is stressed beyond point B, the plastic stage will reach i.e. on the the load, the material will not be able to recover its original size and shape. A little consideration will show that beyond point B, the strain increases at a faster rate with any increase in the stress until the point C is reached. At this point, the material yields before the load and there is an appreciable strain without any increase in stress. In case of mild steel, it will be seen that a small load drops to D, immediately after yielding commences. Hence there are two yield points C and D. The points C and D are called the upper and lower yield points respectively. The stress corresponding to yield point is known as yield point stress. 4. Ultimate stress. At D, the specimen regains some strength and higher values of stresses are required for higher strains, than those between A and D. The stress (or load) goes on increasing till the point E is reached. The gradual increase in the strain (or length) of the specimen is followed with the uniform reduction of its cross-sectional area. The work done, during stretching the specimen, is transformed largely into heat and the specimen becomes hot. At E, the stress, which attains its maximum value is known as ultimate stress. Itis defined as the largest stress obtained by dividing the largest value of the load reached in a test to the original cross-sectional area of the test piece. 5. Breaking stress. After the specimen has reached the ultimate stress, a neck is formed, which decreases the cross-sectional area ofthe specimen, as shown in Fig. The stress is, therefore, reduced until the the specimen breaks away at point F. The stress corresponding to point F is known as breaking stress.