Introduction
The Vapour Compression Refrigeration Cycle (VCRC) is one of the most widely used refrigeration cycles in air conditioning and refrigeration systems. Understanding the cycle through T-S (Temperature-Entropy) and P-h (Pressure-Enthalpy) charts helps in visualizing the thermodynamic processes involved.
Components of Vapour Compression Refrigeration Cycle
The VCRC mainly consists of the following four components:
- Evaporator
- Compressor
- Condenser
- Expansion Valve
These components are connected in a closed loop through which the refrigerant circulates.
Process Description Using T-S and P-h Charts
Below are the processes of the VCRC represented on both T-S and P-h diagrams.
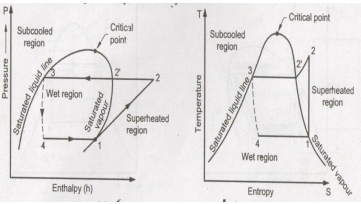
Figure 1: Temperature-Entropy (T-S) Diagram
1. Process 1–2: Isentropic Compression
- On T-S Chart: Vertical line from point 1 to 2 (Entropy remains constant)
- On P-h Chart: Steep rise from point 1 to 2
- Explanation: Dry saturated vapour enters the compressor at low pressure (Point 1). It is compressed isentropically (without change in entropy) to a high pressure (Point 2). As a result, both pressure and temperature increase.
2. Process 2–3: Constant Pressure Heat Rejection (Condensation)
- On T-S Chart: Horizontal line from point 2 to 3 (constant pressure, decreasing entropy)
- On P-h Chart: Horizontal line from point 2 to 3
- Explanation: At point 2, the high-pressure vapour enters the condenser. Here, it rejects heat at constant pressure. The vapour condenses into saturated liquid at point 3 by losing its latent heat.
3. Process 3–4: Throttling (Expansion)
- On T-S Chart: Sudden drop from point 3 to 4
- On P-h Chart: Vertical line from point 3 to 4 (enthalpy remains constant)
- Explanation: The saturated liquid refrigerant passes through the expansion valve or capillary tube. Pressure drops rapidly, causing partial evaporation. The enthalpy remains constant but quality of refrigerant changes.
4. Process 4–1: Constant Pressure Heat Absorption (Evaporation)
- On T-S Chart: Horizontal line from point 4 to 1
- On P-h Chart: Gradual increase from point 4 to 1
- Explanation: The low-pressure liquid-vapour mixture enters the evaporator. It absorbs heat from the surroundings and evaporates completely into dry saturated vapour at point 1, completing the cycle.
Conclusion
The vapour compression refrigeration cycle is best understood using the T-S and P-h diagrams. These diagrams help visualize how the refrigerant changes phase, pressure, and temperature during the cycle. Understanding this helps in system design, troubleshooting, and energy efficiency improvement.
You can also explore more on Wikipedia – Vapour Compression Cycle